Prometheus
Prometheus is an open-source systems monitoring and alerting toolkit. This is the recommended metric driver and is perfect for integrated environments like Kubernetes and Docker.
Configuration
This is the default configuration for the Prometheus driver. This is not the configuration for Prometheus.
This file is located in one of these, depending on your platform:
plugins/UnifiedMetrics/driver/prometheus.ymlplugins/unifiedmetrics/driver/prometheus.ymlmods/UnifiedMetrics/driver/prometheus.ymlconfig/unifiedmetrics/driver/prometheus.yml
# HTTP: Scrape via HTTP endpoint
# PUSHGATEWAY: Pushes to a remote PushGateway server. THIS IS *NOT* remote_write!
mode: "HTTP"

# Applies to "HTTP" mode.
http:
  host: "0.0.0.0"
  # The default in 0.4.x will be 9970.
  # Note that this port needs to match the port that you have allocated
  port: 9100
  authentication:
    # Authentication is encouraged when using a shared host or when exposing the endpoint publicly
    # NONE: Authentication disabled
    # BASIC: Username/password authentication
    scheme: "NONE"
    username: "username"
    password: "password"

# Applies to "PUSHGATEWAY" mode.
# Note that this is NOT compatible with remote_write.
pushGateway:
  job: "unifiedmetrics"
  url: "http://pushgateway:9091"
  authentication:
    # NONE: Authentication disabled
    # BASIC: Username/password authentication
    scheme: "BASIC"
    username: "username"
    password: "password"
  # The push interval in seconds
  interval: 10
Networking
Pterodactyl (same host)
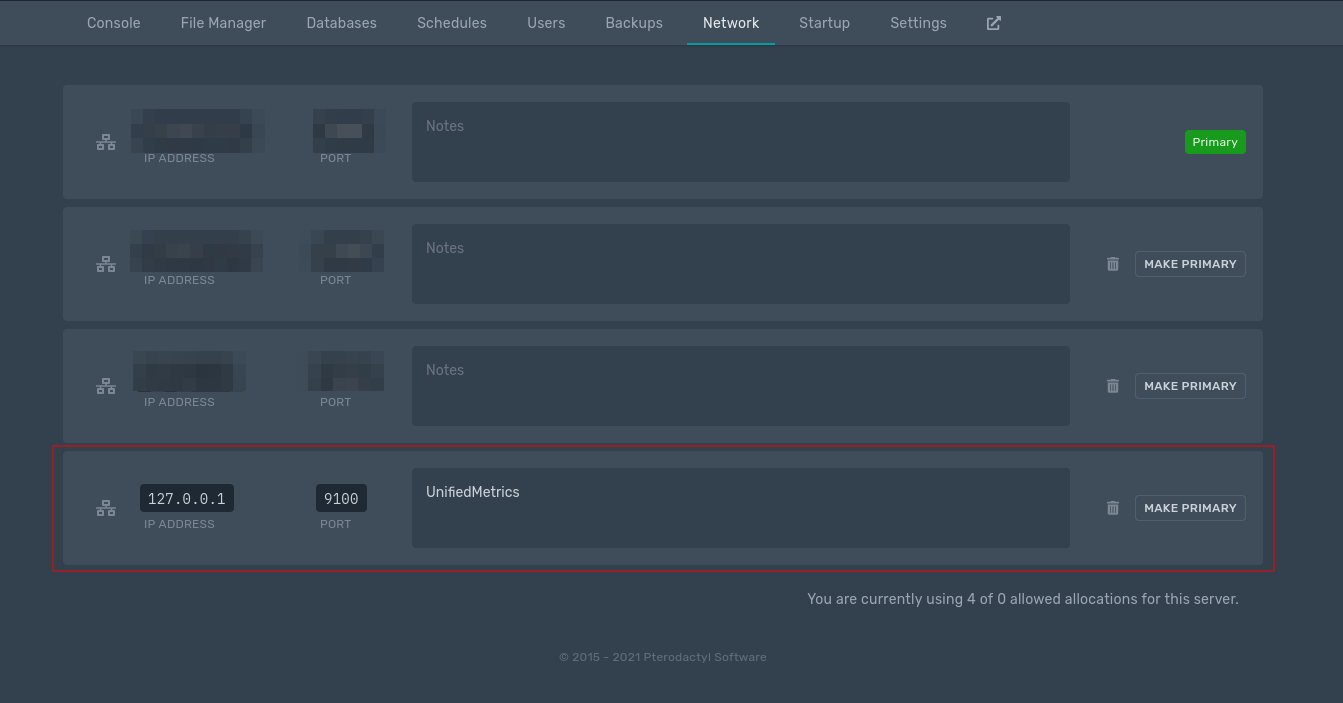
If you are using Pterodactyl and are planning to monitor it from the same host, create a local allocation (127.0.0.1)
in the panel. Ensure that the port you allocate matches the one in the configuration.
Then, configure your firewall (if applicable). This should not apply to shared hosts.
The following command will allow any server on the node to access the opened port. This may allow a malicious server on the node to perform a Denial-of-Service (DoS) attack on your server.
UFW (Debian/Ubuntu):
# Make sure to replace 9100 with the port you configured
# The ip address may be different depending on your configuration (check ip a)
$ sudo ufw allow in on pterodactyl0 to 172.18.0.1 port 9100 proto tcp
Pterodactyl (multi-host)
Create a node port allocation (e.g. 0.0.0.0) with the configured UnifiedMetrics port and apply it to the server.
This is highly discouraged and should be avoided when possible.
Exposing UnifiedMetrics publicly (0.0.0.0) may allow attackers to perform Denial-of-Service (DoS) attack on your
server. Secure your endpoint by applying authentication, firewall, and/or VPN tunnels.
Other deployment solutions
Simply bind UnifiedMetrics' port to a private network interface or public interface (NOT RECOMMENDED). Make sure that you allow Prometheus to communicate with the server.
Exposing UnifiedMetrics publicly (0.0.0.0) may allow attackers to perform Denial-of-Service (DoS) attack on your
server. Secure your endpoint by applying authentication, firewall, and/or VPN tunnels.
Installing Prometheus
Prometheus can be installed in multiple ways, depending on your environment. You may also install Prometheus directly on your machine. Alternatively, VictoriaMetrics can be used as a drop-in alternative for Prometheus.
Prometheus (Docker Compose)
Pros:
- Declarative configuration
- Integrates nicely with existing Minecraft containers
Cons:
- Can be confusing for beginners
First, install Docker Compose on your server. Then create a compose file
somewhere, like ~/.deployment/metrics/docker-compose.yml.
# docker-compose.yml

version: "3"

services:
  prometheus:
    image: prom/prometheus
    restart: always
    security_opt:
      - no-new-privileges:true
    volumes:
      - ./prometheus.yml:/etc/prometheus/prometheus.yml
      # Remove this line if remote_write is used
      - data-prometheus:/prometheus
    networks:
      # Change this to "pterodactyl_nw" and external to true IF you are using Pterodactyl
      - prometheus

networks:
  # Change this to "pterodactyl_nw" and external to true IF you are using Pterodactyl
  prometheus:
    external: true

# Remove this section if remote_write is used
volumes:
  data-prometheus:
Then create a network if you are NOT USING Pterodactyl.
$ docker network create prometheus
We'll not start Prometheus yet, since we need to configure it first.
Prometheus (Pterodactyl)
Pros:
- Easy to set up
- Integrates nicely with your existing servers
Cons:
- Some shared hosts may not support it
First, start by importing the Prometheus egg in your panel. Then, create a new server with the egg.
Finally, start and stop the server. We'll need to configure it first.
The Prometheus egg has web interface enabled by default. This may pose security risks if not configured properly.
Grafana Agent (Docker Compose)
This method is used to push metrics to a remote Prometheus server using remote_write
(for example, Grafana Cloud).
Pros:
- Declarative configuration
- Integrates nicely with existing Minecraft containers
- Perfect for
remote_write
Cons:
- Can be confusing for beginners
First, install Docker Compose on your server. Then create a compose file
somewhere, like ~/.deployment/metrics/docker-compose.yml.
# docker-compose.yml

version: "3"

services:
  agent:
    image: grafana/agent:latest
    restart: always
    container_name: agent
    security_opt:
      - no-new-privileges:true
    volumes:
      - ./agent.yml:/etc/agent-config/agent.yml
    entrypoint:
      - /bin/agent
      - -config.file=/etc/agent-config/agent.yml
      - -prometheus.wal-directory=/tmp/agent/wal
    networks:
      # Change this to "pterodactyl_nw" and external to true IF you are using Pterodactyl
      - prometheus

networks:
  # Change this to "pterodactyl_nw" and external to true IF you are using Pterodactyl
  prometheus:
    external: true
Then create a network if you are NOT USING Pterodactyl.
$ docker network create prometheus
Finally, run docker compose up -d --remove-orphans to start Grafana Agent.
$ cd ~/.deployment/metrics
$ docker compose up -d --remove-orphans
We'll not start Grafana Agent yet, since we need to configure it first.
Configuring Prometheus
There are multiple configurations possible for Prometheus. Some configurations may fit your environment better than others. Please read the comments on the configuration file.
Prometheus
Docker Compose:
This file should be located in the same directory as your docker-compose.yml file.
# prometheus.yml

global:
  scrape_interval: 10s

scrape_configs:
  # Create as many jobs as you'd like
  - job_name: "smp-1"
    static_configs:
      # Replace this with the IP address or hostname of your server
      # This will be the service name for Docker Compose users
      - targets: [ "172.18.0.1:9100" ]
        # Customize or/and rewrite your labels (optional)
        labels:
          # The instance label will be shown on the dashboard
          # This is the server's IP address by default
          instance: "smp-1.node1.local"

    # Remove this section if you are not using BASIC authentication
    basic_auth:
      username: "username"
      password: "password"

# Remove this section if you are not using remote_write
# Create a new API key if you are using Grafana Cloud
remote_write:
  - url: https://prometheus-us-central1.grafana.net/api/prom/push
    basic_auth:
      username: 12345
      password: "insert_api_token_here"
Finally, start Prometheus.
Docker Compose:
$ cd ~/.deployment/metrics
$ docker compose up -d --remove-orphans
Grafana Agent
Docker Compose:
This file should be located in the same directory as your docker-compose.yml file.
# agent.yml

prometheus:
  global:
    scrape_interval: 10s
  configs:
    - name: minecraft
      host_filter: false
      scrape_configs:
        - job_name: "smp-1"
          static_configs:
            # Replace this with the IP address or hostname of your server
            # This will be the service name for Docker Compose users
            - targets: [ "172.18.0.1:9100" ]
              # Customize or/and rewrite your labels (optional)
              labels:
                # The instance label will be shown on the dashboard
                # This is the server's IP address by default
                instance: "smp-1.node1.local"

          # Remove this section if you are not using BASIC authentication
          basic_auth:
            username: "username"
            password: "password"

      # Create an account at https://grafana.com/ and create an organization, if you are using Grafana Cloud.
      # Put Prometheus remote write credentials here. Make sure to update the push URL to match yours.
      remote_write:
        - url: https://prometheus-us-central1.grafana.net/api/prom/push
          # Create an API key with write scope on Grafana Cloud
          basic_auth:
            username: 12345
            password: "insert_api_key_here"
Finally, start Grafana Agent.
Docker Compose:
$ cd ~/.deployment/metrics
$ docker compose up -d --remove-orphans
Grafana Cloud
Grafana Cloud offers a free hosted Grafana instance and Prometheus instance. This is useful for small servers.
You need to host your own Prometheus/Grafana Agent to push metrics to Grafana Cloud.